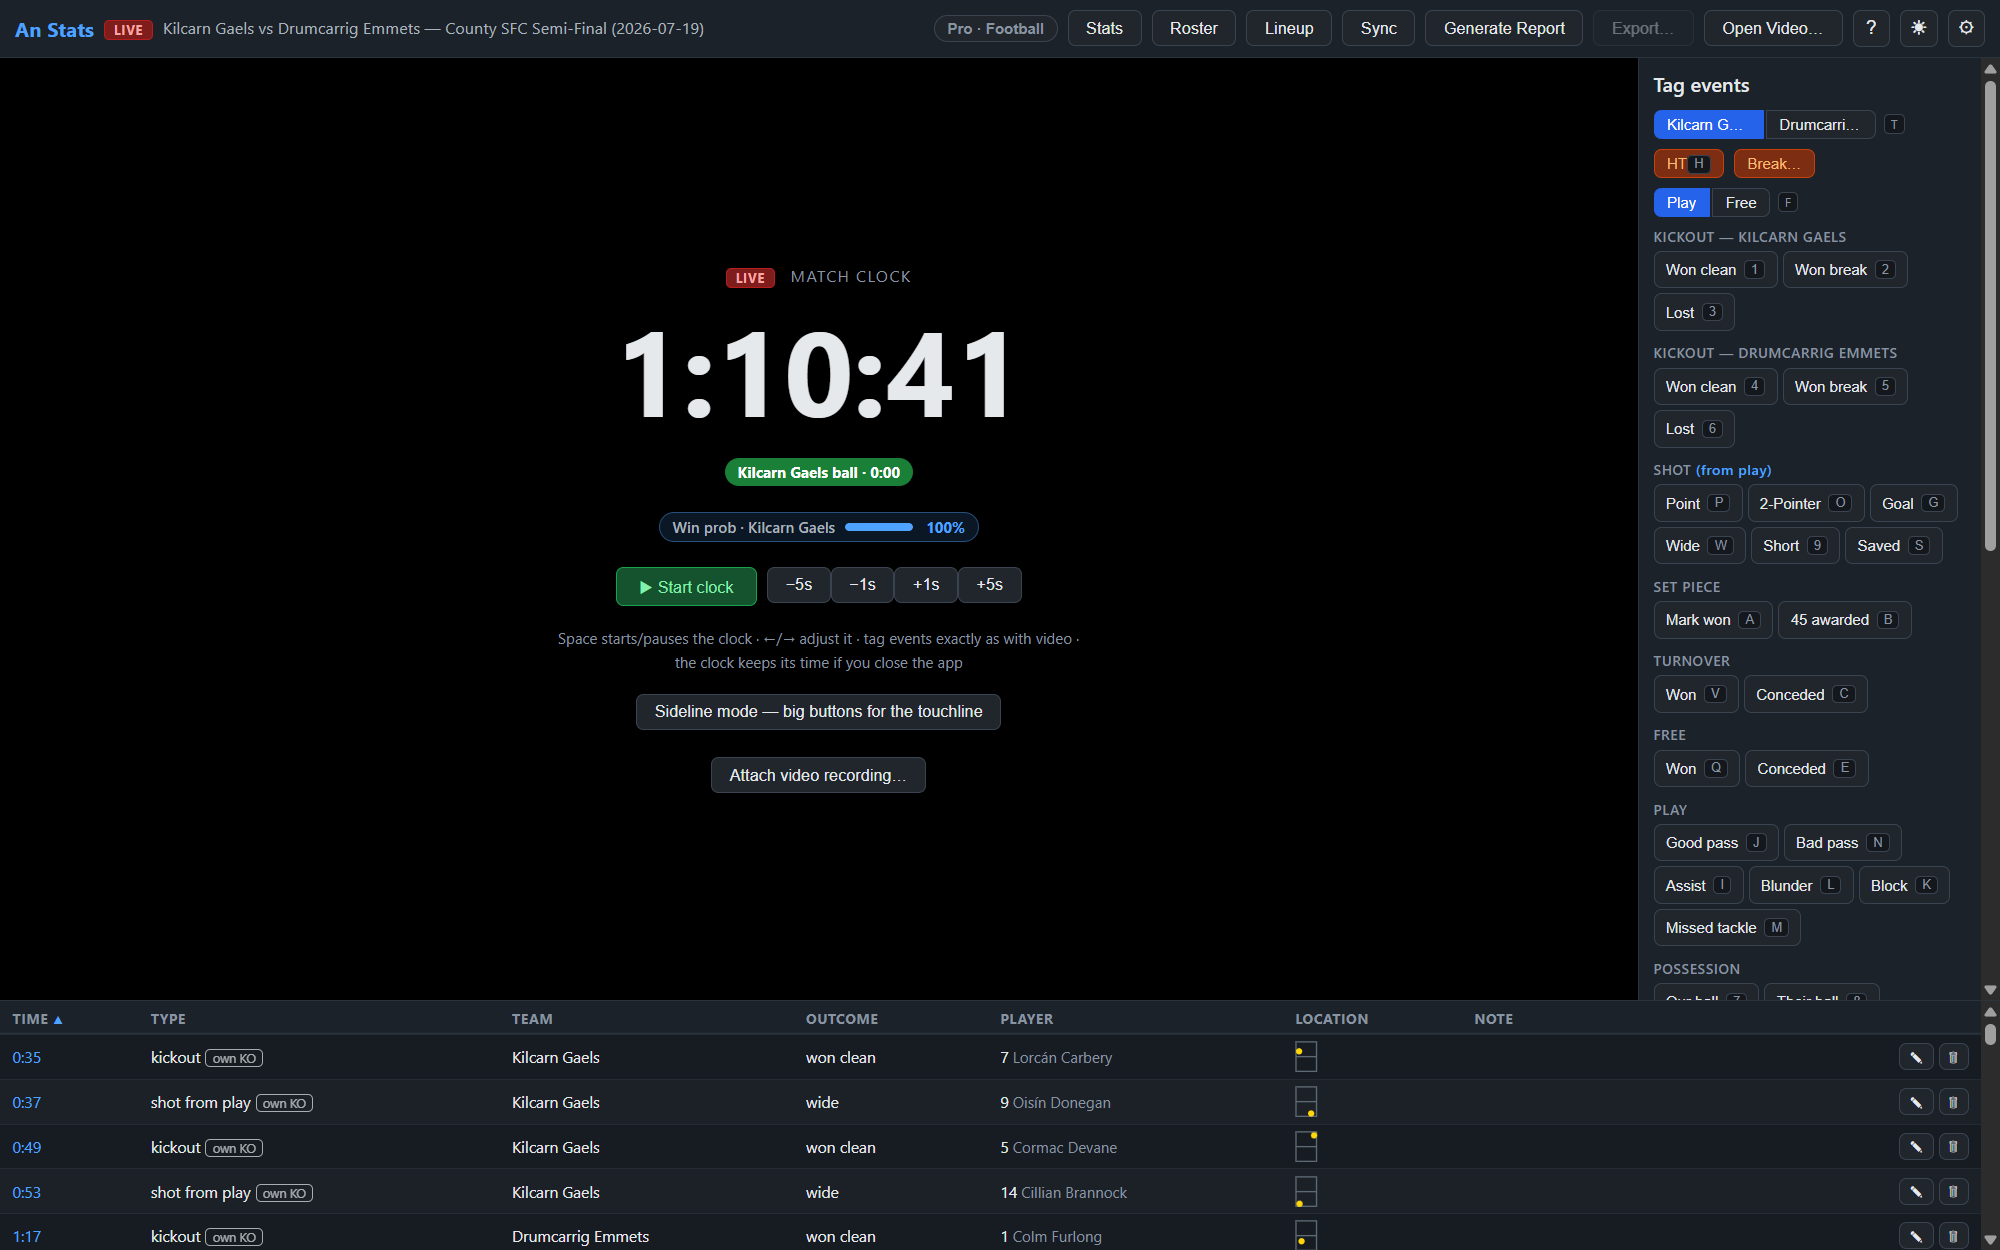
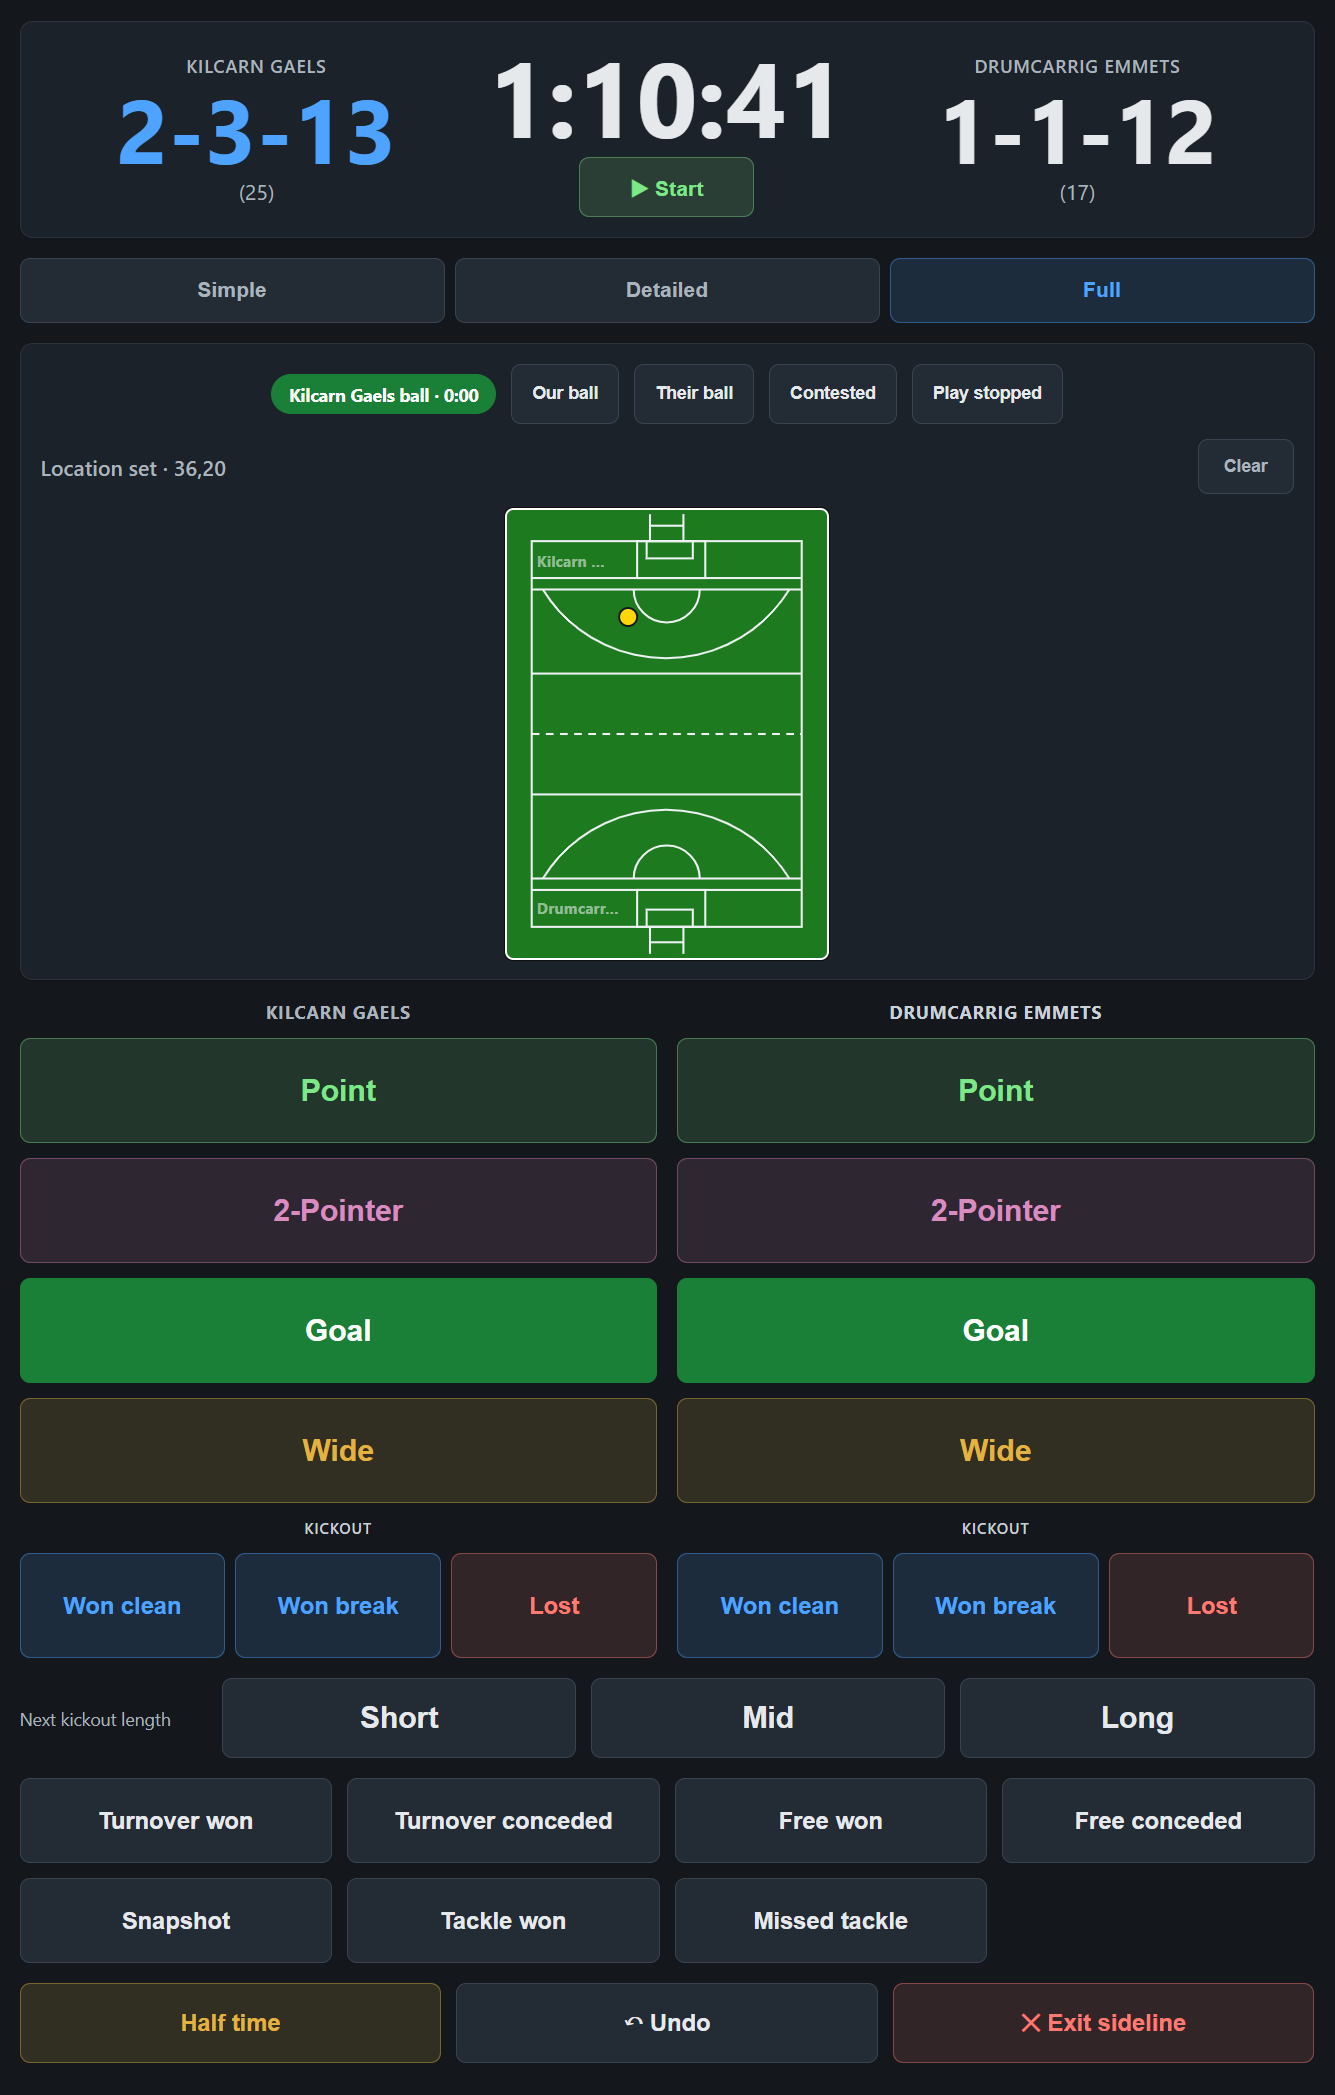
Tag the match, generate the report, run the video session — entirely offline, on your own laptop. An Stats covers football, hurling, camogie and ladies football, from club to county.
Kickouts, shots, turnovers, frees and discipline — captured as fast as the game happens, live from the stand or off the recording. No spreadsheets, no second screen.
Every kickout or puckout is logged won clean, won on the break or lost — so restart strategy is discussed on numbers rather than impressions.
Point, two-pointer, goal, wide, short or saved, from play or from a free — and where on the pitch it was struck. That location data powers the shot maps and expected points in the report.
Attach a shirt number or a note to any event. Set up the roster once and names follow through the event list, the reports and the season statistics.
Cards, marks, 45s and 65s — each code carries exactly the events its rules provide, and discipline feeds directly into the player statistics.
Rename or hide any button, or define entirely custom events — they carry through the reports and exports like everything else.
A single undo corrects a mis-tag, and every event can be edited or relocated afterwards — the report stays right even when match day is hectic.
Drag any recording onto the window and it plays — camcorder, phone or camera-system export. Variable playback speed for tight review, and every tagged event appears as a coloured marker on the scrubber; click one to jump straight to it.
Tag half time, quarters or water breaks and ends swap automatically where they should. Every period you mark becomes its own section of the report, with its own statistics and maps.
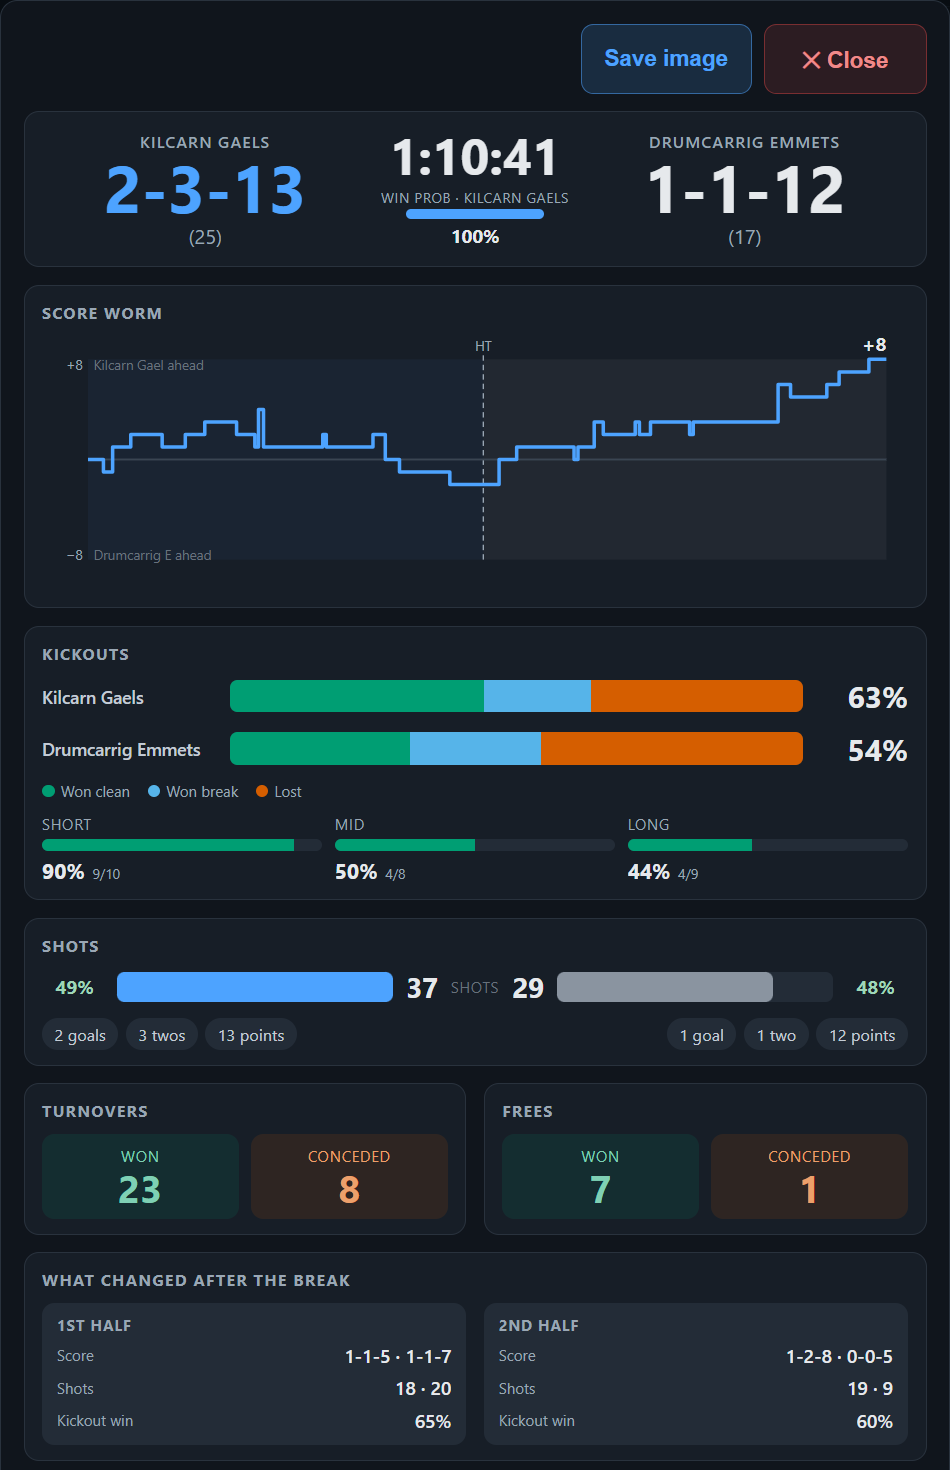
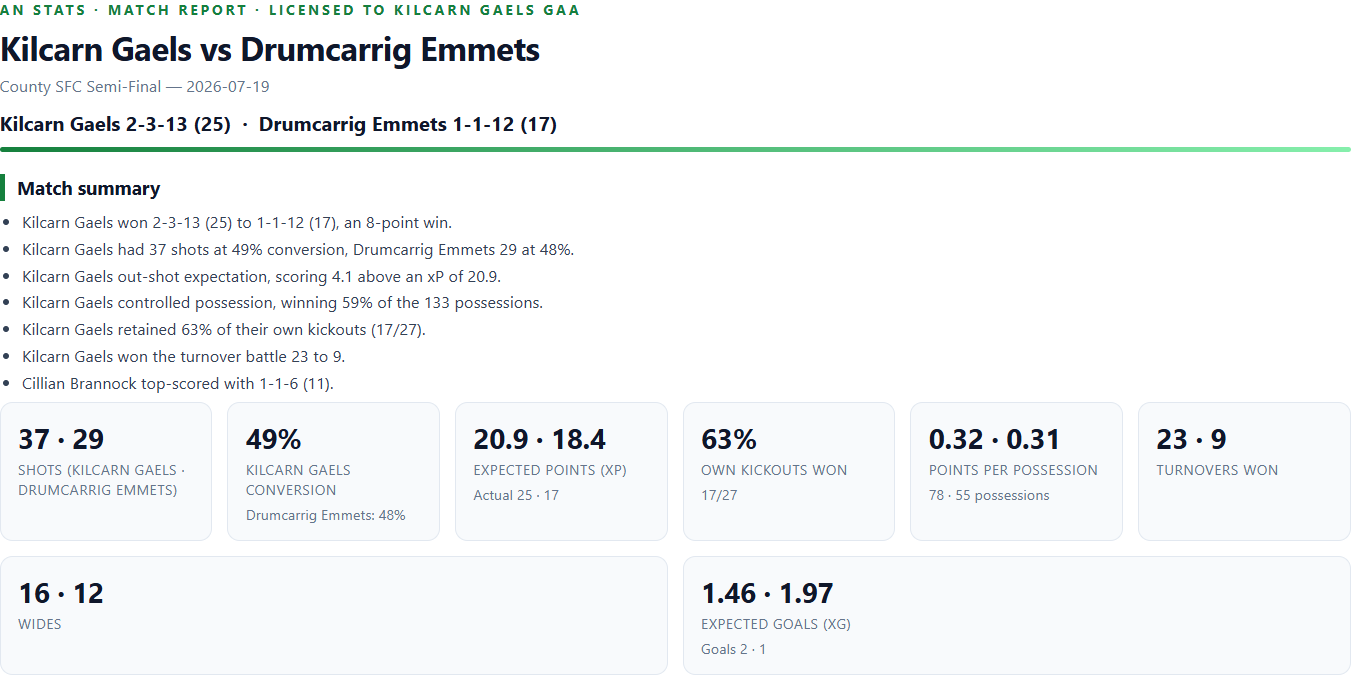
Press Generate Report and the tagged events become a match report you can hand straight to management — filterable to one half, one period or one event type, and saved as a PDF. What follows is redrawn from a sample report:
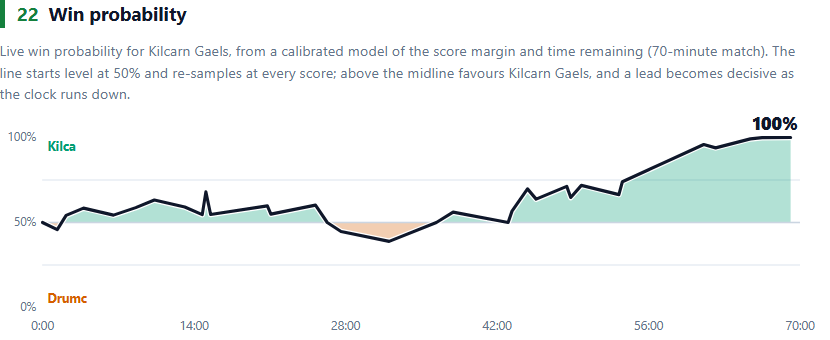
Every tagged event rolls into one curve over the running points difference — the spell where the game turned, identified with timestamps rather than recollections.
The match in five bars — when the scoreline flatters one team, this is where it shows.
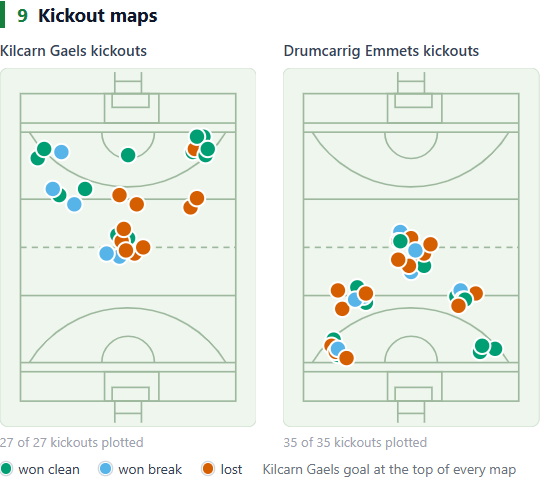
Every kickout won clean, won on the break or lost.
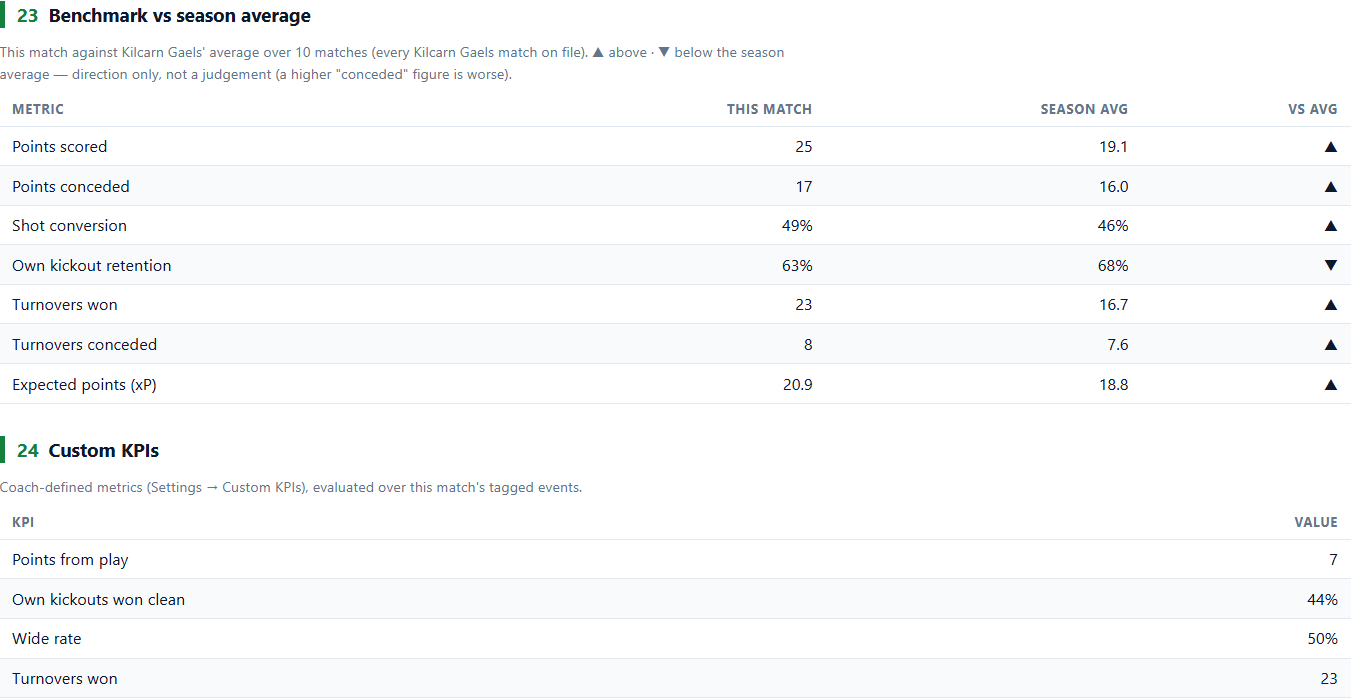
Chance quality separated from finishing — above xP, the forwards delivered.
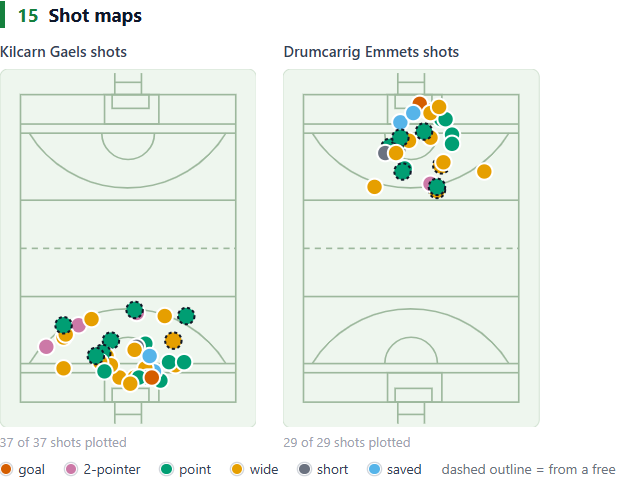
Locations captured with one click during tagging become shot maps, kickout maps and activity heatmaps — shown here for one team; the report carries both.
Every located shot, coloured by outcome — with the two-pointers where the rules put them, outside the arc.
Short kickouts hit the flanks and come back clean; the contested ones break in the middle third, and the long deliveries past halfway are where this one was lost. The short-versus-long argument, settled.
Where the team actually played the game — and the third of the pitch they never reached.
That's a sample of seven sections from fourteen. The saved PDF also carries score by period, possessions and points per possession by source, shooting tables, scorers with roster names, turnover maps and a full event timeline — filterable to any half, period or event type.
Possessions are inferred by chaining the tagged events: a restart or turnover starts one, a shot ends it. Points per possession measures how efficiently possession turns into scores.
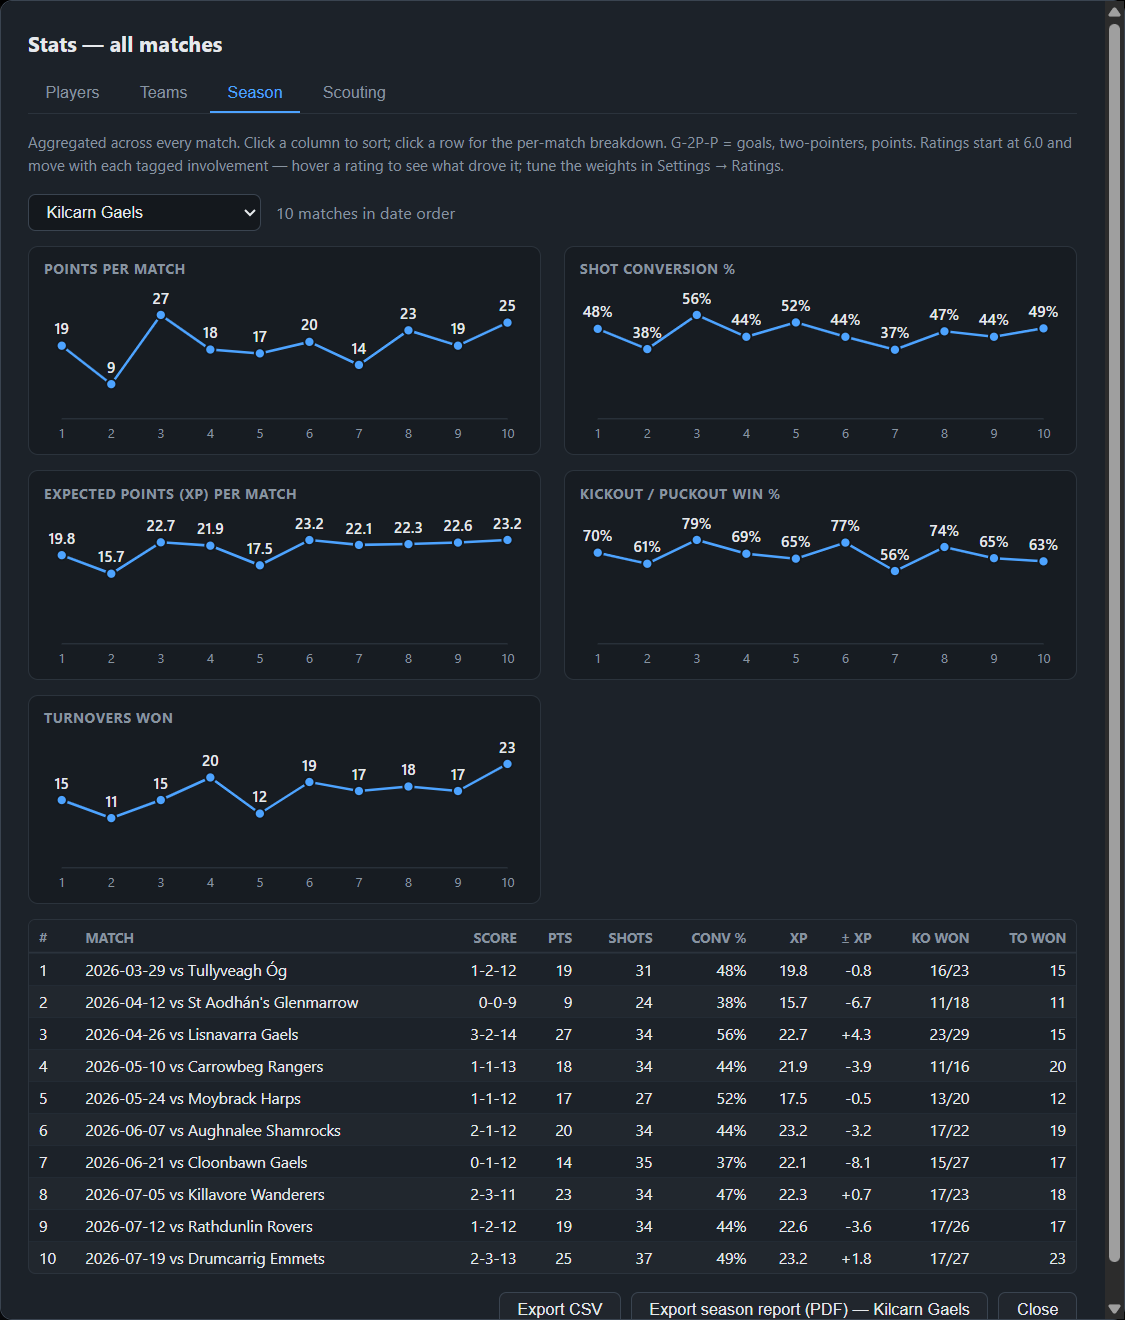
From Sunday's game to Tuesday's session to the season building behind it — with every file backed up along the way.
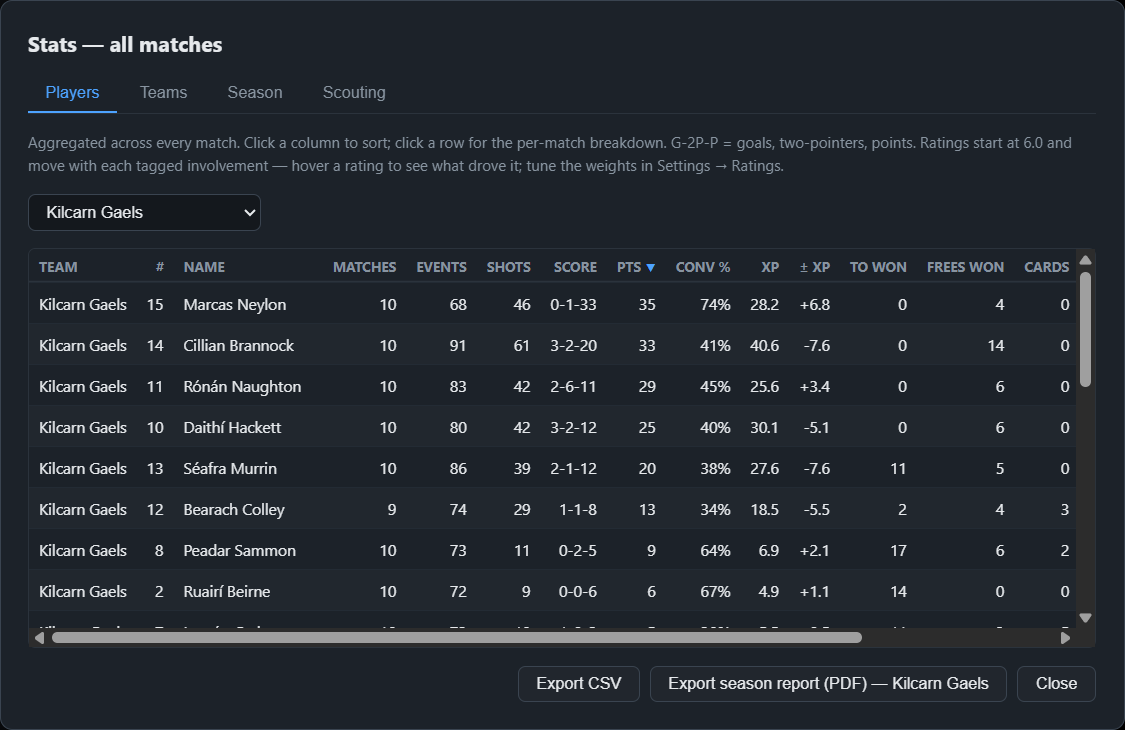
The events you tag during matches build into season-long profiles of your own players — and dossiers on every opponent you meet.
Every export and report save writes a full copy of your database and queues it — with the clips, reels and PDFs — for your own Google Drive. Offsite, automatic, and out of your way.
No tiers, no per-seat pricing, no "contact sales". A licence covers your whole setup — club, school or county — every team, every code, on as many of your machines as you need.
Want to see it on your own footage first? Email us for a free trial — tag a real match, generate the report, run a session off it, then decide.
Yes. The application, your video and your database all live on your own laptop — nothing is uploaded, and no connection is needed to tag, report or export. The optional Google Drive sync backs up your database whenever you're next online.
Anything your machine can play — MP4 from a camcorder or a phone, Veo and similar camera exports. Drag the file onto the window and start.
Your whole organisation — every team in the club, school or county setup, on as many of your machines as you need. Separate organisations hold separate licences.
It's your data, on your machine, in a standard SQLite database. It never expires, and your exported reports, clips and CSVs are yours forever. Renewal covers updates and support.
Windows 10 or 11, 64-bit. Any laptop from the last several years runs it comfortably — clip export uses stream copy, so there's no heavy re-encoding. macOS is on the roadmap; tell us if that's what your setup needs.
Each shot gets a scoring probability from where on the pitch it was taken, times the value of the attempt — goal chances 3, two-pointers 2, points 1. Frees are modelled as more repeatable than shots from play, and shots without a tagged location fall back to league-average probabilities. Finishing ± above xP means the team shot better than the chances it created.
Email info@anstats.com and we'll invoice the club or board directly — no card details entered anywhere. You'll receive the installer and your licence by return, and a free trial first if you'd like to run it on your own footage before committing.
The report, the clips and the numbers — from one person, one laptop, one recording.